The Shape of Age
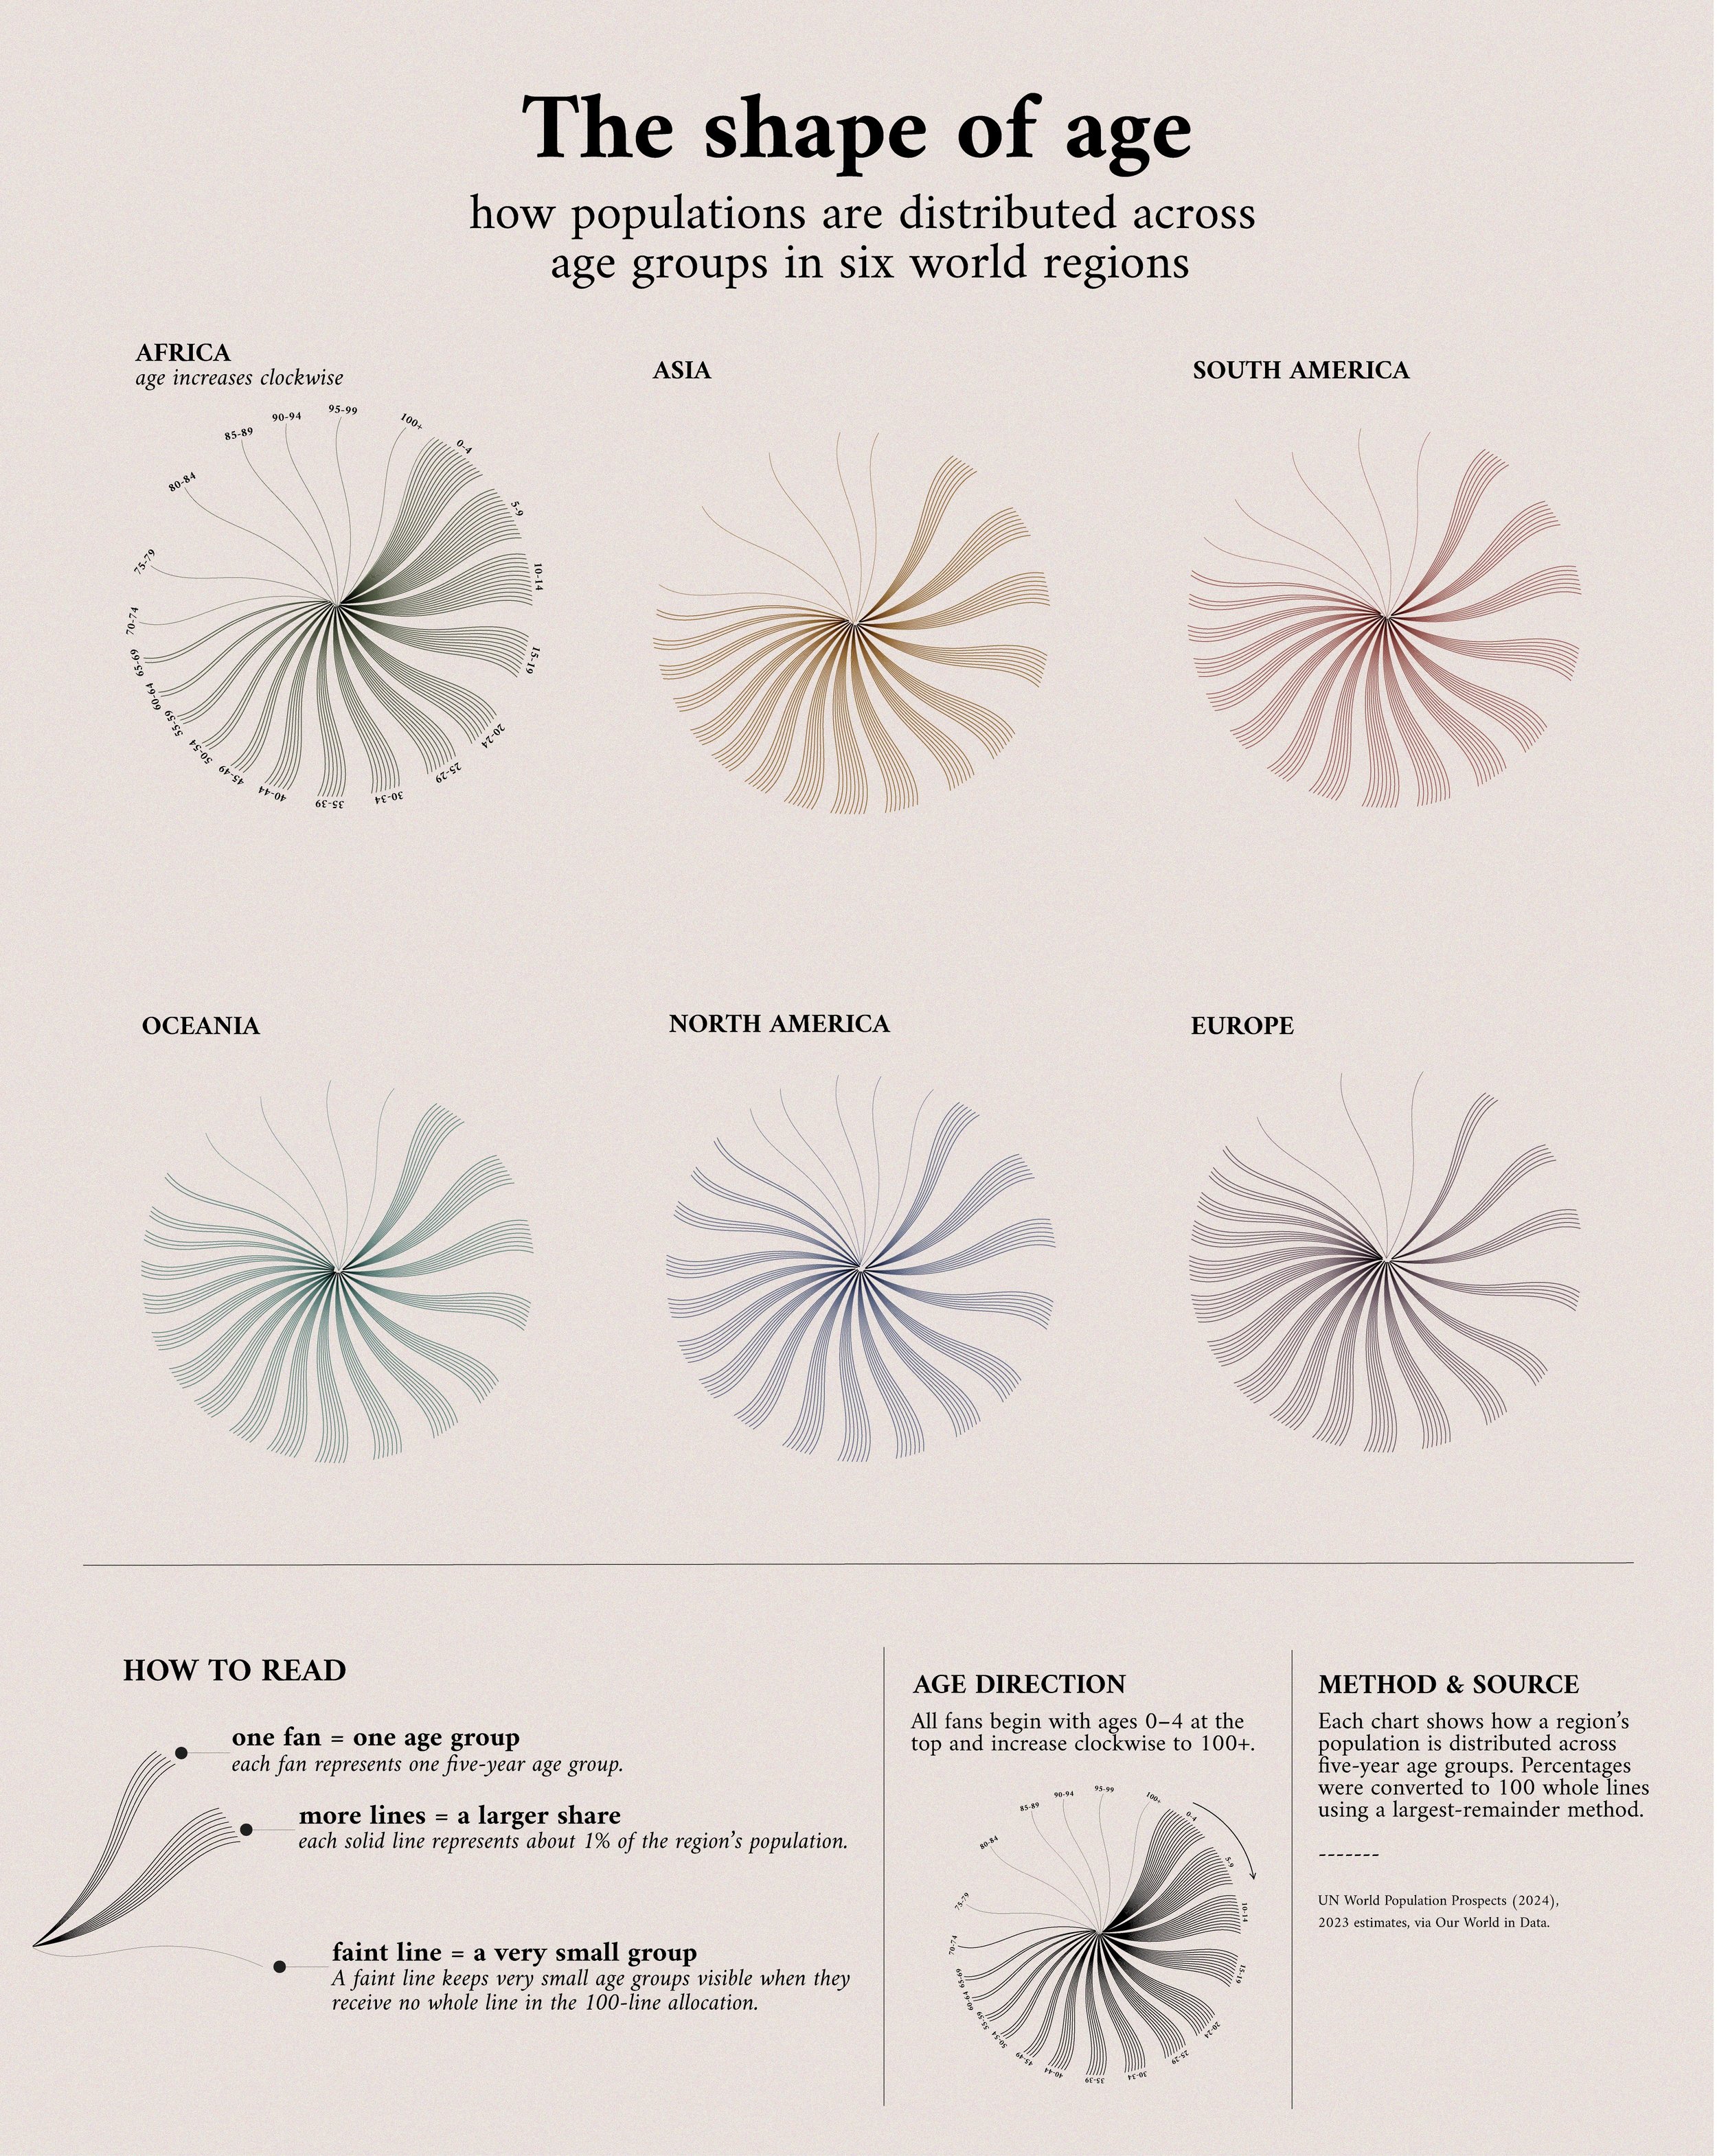
I wanted to experiment with turning a familiar dataset into a less conventional visual form. Using 2023 population estimates, I compared the age structure of six world regions and built a custom visual system to show how their populations are distributed across five-year age groups.
Each fan represents one age group, and each line represents approximately 1% of that region’s population.
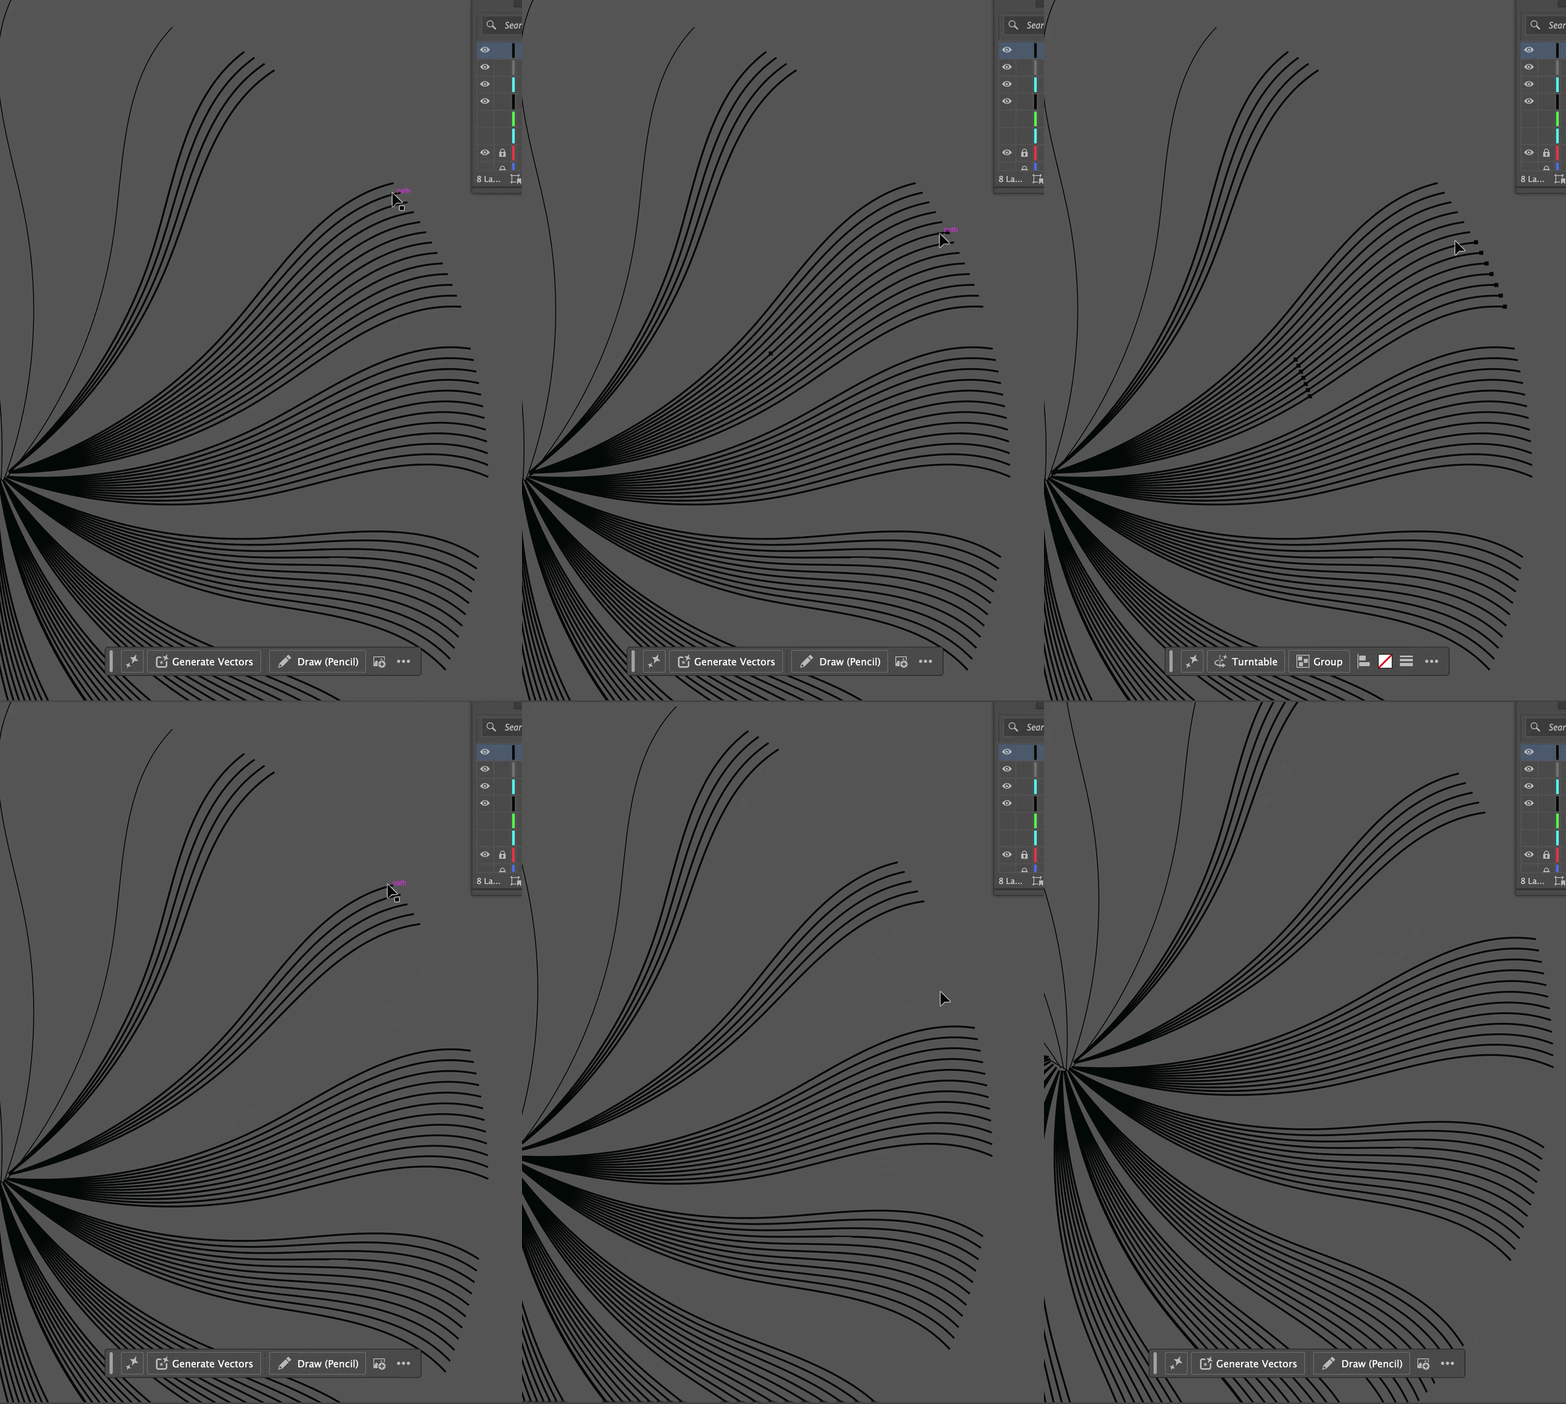
I prepared and explored the data before using RAWGraphs as a starting point, then rebuilt and designed the final visualization in Adobe Illustrator.
Data: UN World Population Prospects (2024), via Our World in Data Tools: RAWGraphs · Adobe Illustrator